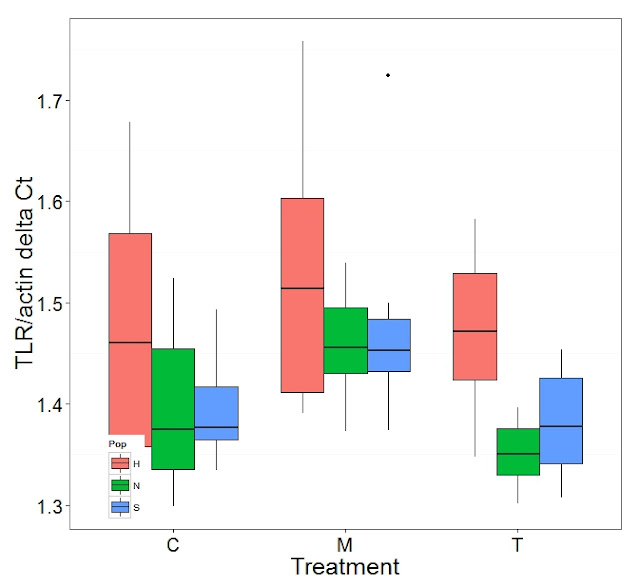
#Necessary Packages to manipulate data and plot values.
require(plyr)
require(ggplot2)
require(splitstackshape)
#Read in mean Ct value table
dCt<-read.csv("CTvalues83115.csv", header=T)
#Split SAMPLE_ID column to create columns for population, treatment, and sample number
dCt<-cSplit(dCt,"SAMPLE_ID", sep= "_", drop=F)
#rename columns appropriately
dCt<-rename(dCt,replace=c("SAMPLE_ID_1"="Pop","SAMPLE_ID_2"="Treat","SAMPLE_ID_3"="Sample"))
#divide each target of interest by the mean Ct value of the Actin Normalizing gene
dCt$CARM<-(dCt$CarmmeanCt/dCt$Actinmeanct)
dCt$TLR<-(dCt$TLRaverage/dCt$Actinmeanct)
dCt$CRAF<-(dCt$CRAFctaverage/dCt$Actinmeanct)
dCt$H2AV<-(dCt$H2AVavgct/dCt$Actinmeanct)
dCt$PGRP<-(dCt$PGRPaverage/dCt$Actinmeanct)
dCt$HSP70<-(dCt$HSP70averageCt/dCt$Actinmeanct)
dCt$BMP2<-(dCt$BMP2average/dCt$Actinmeanct)
dCt$GRB2<-(dCt$GRB2average/dCt$Actinmeanct)
dCt$PGEEP4<-(dCt$PGEEP4ctav/dCt$Actinmeanct)
#log transform the data to develop normality in data
dCt$CARMlog<-log(dCt$CARM)
dCt$TLRlog<-log(dCt$TLR)
dCt$H2AVlog<-log(dCt$H2AV)
dCt$PGRPlog<-log(dCt$PGRP)
dCt$HSP70log<-log(dCt$HSP70)
dCt$BMP2log<-log(dCt$BMP2)
dCt$GRB2log<-log(dCt$GRB2)
dCt$PGEEP4log<-log(dCt$PGEEP4)
dCt$CRAFlog<-log(dCt$CRAF)
#Run ANOVA's on all log transformed data as well as Tukey's Honestly Significant Difference post hoc test
CARM<-aov(CARMlog~Pop+Treat+Pop:Treat, data=dCt)
CARM
TukeyHSD(CARM)
TLR<-aov(TLRlog~Pop+Treat+Pop:Treat, data=dCt)
TLR
TukeyHSD(TLR)
H2AV<-aov(H2AVlog~Pop+Treat+Pop:Treat, data=dCt)
H2AV
TukeyHSD(H2AV)
PGRP<-aov(PGRPlog~Pop+Treat+Pop:Treat, data=dCt)
PGRP
TukeyHSD(PGRP)
HSP70<-aov(HSP70log~Pop+Treat+Pop:Treat, data=dCt)
HSP70
TukeyHSD(HSP70)
BMP2<-aov(BMP2log~Pop+Treat+Pop:Treat, data=dCt)
BMP2
TukeyHSD(BMP2)
GRB2<-aov(GRB2log~Pop+Treat+Pop:Treat, data=dCt)
GRB2
TukeyHSD(GRB2)
PGEEP4<-aov(PGEEP4log~Pop+Treat+Pop:Treat, data=dCt)
PGEEP4
TukeyHSD(PGEEP4)
CRAF<-aov(CRAFlog~Pop+Treat+Pop:Treat, data=dCt)
CRAF
TukeyHSD(CRAF)
#graph all raw mean Ct values to produce boxplots to visualize data
ggplot(data=dCt)+geom_boxplot(aes(x=Treat, y=CARM,fill=Pop))+theme_bw()+
theme(axis.text.x=element_text(size=20), axis.text.y=element_text(size=20),
axis.title.x=element_text(size=25), axis.title.y=element_text(size=25),
legend.position=c(.1,.1),panel.grid.major=element_blank())+
labs(x="Treatment", y="target/actin delta Ct")
ggplot(data=dCt)+geom_boxplot(aes(x=Treat, y=TLR, fill=Pop))+theme_bw()+
theme(axis.text.x=element_text(size=20), axis.text.y=element_text(size=20),
axis.title.x=element_text(size=25), axis.title.y=element_text(size=25),
legend.position=c(.1,.1),panel.grid.major=element_blank())+
labs(x="Treatment", y="target/actin delta Ct")
ggplot(data=dCt)+geom_boxplot(aes(x=Treat, y=H2AV,fill=Pop))+theme_bw()+
theme(axis.text.x=element_text(size=20), axis.text.y=element_text(size=20),
axis.title.x=element_text(size=25), axis.title.y=element_text(size=25),
legend.position=c(.1,.1),panel.grid.major=element_blank())+
labs(x="Treatment", y="target/actin delta Ct")
ggplot(data=dCt)+geom_boxplot(aes(x=Treat, y=PGRP,fill=Pop))+theme_bw()+
theme(axis.text.x=element_text(size=20), axis.text.y=element_text(size=20),
axis.title.x=element_text(size=25), axis.title.y=element_text(size=25),
legend.position=c(.1,.1),panel.grid.major=element_blank())+
labs(x="Treatment", y="target/actin delta Ct")
ggplot(data=dCt)+geom_boxplot(aes(x=Treat, y=HSP70,fill=Pop))+theme_bw()+
theme(axis.text.x=element_text(size=20), axis.text.y=element_text(size=20),
axis.title.x=element_text(size=25), axis.title.y=element_text(size=25),
legend.position=c(.1,.1),panel.grid.major=element_blank())+
labs(x="Treatment", y="target/actin delta Ct")
ggplot(data=dCt)+geom_boxplot(aes(x=Treat, y=BMP2,fill=Pop))+theme_bw()+
theme(axis.text.x=element_text(size=20), axis.text.y=element_text(size=20),
axis.title.x=element_text(size=25), axis.title.y=element_text(size=25),
legend.position=c(.1,.1),panel.grid.major=element_blank())+
labs(x="Treatment", y="target/actin delta Ct")
ggplot(data=dCt)+geom_boxplot(aes(x=Treat, y=GRB2,fill=Pop))+theme_bw()+
theme(axis.text.x=element_text(size=20), axis.text.y=element_text(size=20),
axis.title.x=element_text(size=25), axis.title.y=element_text(size=25),
legend.position=c(.1,.1),panel.grid.major=element_blank())+
labs(x="Treatment", y="target/actin delta Ct")
ggplot(data=dCt)+geom_boxplot(aes(x=Treat, y=PGEEP4,fill=Pop))+theme_bw()+
theme(axis.text.x=element_text(size=20), axis.text.y=element_text(size=20),
axis.title.x=element_text(size=25), axis.title.y=element_text(size=25),
legend.position=c(.1,.1),panel.grid.major=element_blank())+
labs(x="Treatment", y="target/actin delta Ct")
ggplot(data=dCt)+geom_boxplot(aes(x=Treat, y=CRAF,fill=Pop))+theme_bw()+
theme(axis.text.x=element_text(size=20), axis.text.y=element_text(size=20),
axis.title.x=element_text(size=25), axis.title.y=element_text(size=25),
legend.position=c(.1,.1),panel.grid.major=element_blank())+
labs(x="Treatment", y="target/actin delta Ct")
Graphs produced
Significant Differences Table
| CARMlog | TLRlog | H2AVlog | PGRPlog | HSP70log | BMP2log | GRB2log | PGEEP4log | CRAFlog | |
| Overall | |||||||||
| C:T | X | X | X | ||||||
| C:M | X | X | X | ||||||
| T:M | X | X | X | X | X | ||||
| N:H | X | ||||||||
| H:S | X | ||||||||
| S:N | X | ||||||||
| Control | |||||||||
| N:H | |||||||||
| H:S | |||||||||
| S:N | |||||||||
| Temperature | |||||||||
| N:H | |||||||||
| H:S | |||||||||
| S:N | |||||||||
| Mechanical | |||||||||
| N:H | |||||||||
| H:S | |||||||||
| S:N | X | ||||||||
| Control:Temp | |||||||||
| N | |||||||||
| H | |||||||||
| S | X | ||||||||
| Control:Mech | |||||||||
| N | |||||||||
| H | |||||||||
| S | X | X | |||||||
| Temp:Mech | |||||||||
| N | |||||||||
| H | |||||||||
| S | X | X | X |
You can find the raw mean Ct values here and the R script here.


