Wednesday, July 29, 2015

7 29 2015 EF1d qPCR 1 & 2

In an effort to find a better normalizing primer than the Actin one I have, I developed 4 possible normalizing primers. Today I ran two replicates of EF1d with a 1:9 dilution of cDNA. 

Primers:

1682EF1d_FWDGAACTGCCCACTGATTTGCCJH7/22/2015205560O.luridaElongation factor 1-delta (EF-1-delta)A5D989
1681EF1d_REVTGTGGGGTGAAACACGTTGAJH7/22/2015205060O.luridaElongation factor 1-delta (EF-1-delta)A5D989
Reagent Table:

VolumeReactions X116
Ssofast Evagreen MM101160
FWD Primer0.558
REV Primer0.558
1:9 cDNA9
  1. Added reagents from greatest to least volume
  2. Vortexed
  3. Centrifuged briefly
  4. Pipetted 11 ul Master Mix to each tube
  5. Pipetted 9 ul of 1:9 cDNA each column using a channel pipetter
  6. Centrifuged plate at 2000 rpm for 1 minute
  7. Ran Program Below
Program:
StepTemperatureTime
Initiation95 C10 min
Elongation95 C30 sec
60 C1 min
Read
72 C30 sec
Read
Repeat Elongation 39 times
Termination95 C1 min
55 C1 sec
Melt Curve Manual ramp 0.2C per sec Read 0.5 C55 - 95 C30 sec
21 C10 min
End
Plate Layout:
1234567
DNased 42215 HC1DNased 42215 NC1DNased 42215 SC1DNased 42215 HT1 1DNased 42215 NT1 1DNased 42215 ST1 1NTC
DNased 42215 HC2DNased 42215 NC2DNased 42215 SC2DNased 42215 HT1 2DNased 42215 NT1 2DNased 42215 ST1 2NTC
DNased 42215 HC3DNased 42215 NC3DNased 42215 SC3DNased 42215 HT1 3DNased 42215 NT1 3DNased 42215 ST1 3NTC
DNased 42215 HC4DNased 42215 NC4DNased 42215 SC4DNased 42215 HT1 4DNased 42215 NT1 4DNased 42215 ST1 4NTC
DNased 42215 HC5DNased 42215 NC5DNased 42215 SC5DNased 42215 HT1 5DNased 42215 NT1 5DNased 42215 ST1 5
DNased 42215 HC6DNased 42215 NC6DNased 42215 SC6DNased 42215 HT1 6DNased 42215 NT1 6DNased 42215 ST1 6
DNased 42215 HC7DNased 42215 NC7DNased 42215 SC7DNased 42215 HT1 7DNased 42215 NT1 7DNased 42215 ST1 7
DNased 42215 HC8DNased 42215 NC8DNased 42215 SC8DNased 42215 HT1 8DNased 42215 NT1 8DNased 42215 ST1 8

Results:
Opticon
All
Amp
 Melt Curve

NTCs
Amp
 Melt Curve

CFX 
All
NTCs

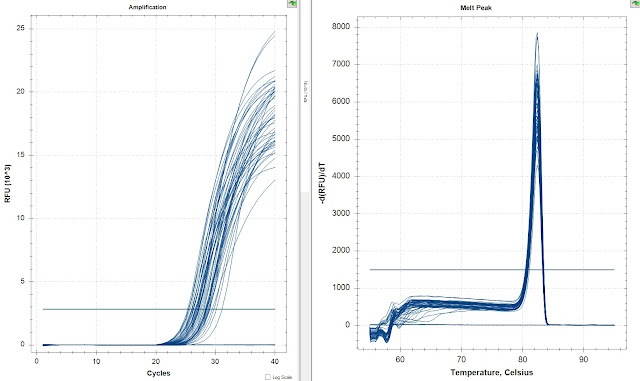
The amplification curves in both runs look great. There's no amplification in either set of NTCs. Also the latest amplifying samples were they same in both replicates. I then compared the replicates with the Opticon Correction to see how close are they. 


There is less than a 2 ct difference between the replicates with correction. The there is one major outlier which is likely caused by mechanical error. 

I will tomorrow I will average the Ct values and efficiencies to develop data to normalize expression data for the other targets. Also I've been reading on how to deal with outliers. If I throw out the data, then it screws up the statistics. One way I've seen this dealt with in the literature is to assume that outliers are caused by mechanical/human error and replace the values with the latest Ct value and efficiency found in the data which assumes the lowest observed expression. 

You can see paper here:

Differential gene expression profiling of Listeria monocytogenes in Cacciatore and Felino salami to reveal potential stress resistance biomarkers


http://www.sciencedirect.com/science/article/pii/S0740002014002329

You can see the raw data from the opticon and from the cfx

Tuesday, July 28, 2015

7 28 2015 Normalizing Gene Primer Tests

In an effort to find a better normalizing primer than the Actin one I have, I developed 4 possible normalizing primers. Today I tested all 4 of them on a 1:9 dilution of cDNA. 

Primers:

1688GAPDH_FWDTGCTCCTTGCATTTCCGTCAJH7/22/2015205060O.luridaGlyceraldehyde-3-phosphate dehydrogenase (GAPDH) (EC 1.2.1.12)Q6BMK0
1687GAPDH_REVCGCTCCTTCCAAGTCTCCAGJH7/22/2015206060O.luridaGlyceraldehyde-3-phosphate dehydrogenase (GAPDH) (EC 1.2.1.12)Q6BMK0
1686Act_FWDGTTCTCCTGTCGGGTGGAAGJH7/22/2015206060O.luridaActinP53498
1685Act_REVCACCATGAAACGCCGACTTGJH7/22/2015205560O.luridaActinP53498
1684EFG_FWDACCCAAGGACAGGGAGAGTTJH7/22/2015205560O.lurida"Elongation factor G, mitochondrial (EF-Gmt) (Elongation factor G 1, mitochondrial) (mEF-G 1) (Elongation factor G1) (Protein iconoclast)"B3MK91
1683EFG_REVTGTGTCCCCTTGTTGCTCTCJH7/22/2015205560O.lurida"Elongation factor G, mitochondrial (EF-Gmt) (Elongation factor G 1, mitochondrial) (mEF-G 1) (Elongation factor G1) (Protein iconoclast)"B3MK91
1682EF1d_FWDGAACTGCCCACTGATTTGCCJH7/22/2015205560O.luridaElongation factor 1-delta (EF-1-delta)A5D989
1681EF1d_REVTGTGGGGTGAAACACGTTGAJH7/22/2015205060O.luridaElongation factor 1-delta (EF-1-delta)A5D989
Reagent Table:

VolumeReactions X116
Ssofast Evagreen MM101160
FWD Primer0.558
REV Primer0.558
1:9 cDNA9
  1. Added reagents from greatest to least volume
  2. Vortexed
  3. Centrifuged briefly
  4. Pipetted 11 ul Master Mix to each tube
  5. Pipetted 9 ul of 1:9 cDNA each column using a channel pipetter
  6. Centrifuged plate at 2000 rpm for 1 minute
  7. Ran Program Below
Program:
StepTemperatureTime
Initiation95 C10 min
Elongation95 C30 sec
60 C1 min
Read
72 C30 sec
Read
Repeat Elongation 39 times
Termination95 C1 min
55 C1 sec
Melt Curve Manual ramp 0.2C per sec Read 0.5 C55 - 95 C30 sec
21 C10 min
End
Plate Layout:
EFGEF1DGAPDHActin
1234
NTCNTCNTCNTC
DNased 42215 HC8DNased 42215 HC7DNased 42215 HC6DNased 42215 HC5
DNased 42215 NC8DNased 42215 NC7DNased 42215 NC6DNased 42215 NC5
DNased 42215 SC8DNased 42215 SC7DNased 42215 SC6DNased 42215 SC5
DNased 42215 HT1 8DNased 42215 HT1 7DNased 42215 HT1 6DNased 42215 HT1 5
DNased 42215 NT1 8DNased 42215 NT1 7DNased 42215 NT1 6DNased 42215 NT1 5
DNased 42215 ST1 8DNased 42215 ST1 7DNased 42215 ST1 6DNased 42215 ST1 5
NTCNTCNTCNTC
Results:
EFG
Amp
 Melt Curve
EF1d
Amp
 Melt Curve
GAPDH
Amp
 Melt Curve
Actin
Amp
 Melt Curve

The best primer looks like it EF1d as the curves are strong and the melt curve is tight. EFG is second best, good curves and ok melt curve. Actin is third best, amplification curves are weak as well as the melt curve. GAPDH failed to amplify. 

So I'm going to run EF1d tomorrow. 

You can see the raw data here

Monday, July 27, 2015

7 24 2015 H3.3 qPCR 2

Today I ran duplicates for the targets I ran last week. I'm hoping to get strong replicates for analysis. Here I ran the H3.3 which last week had issues with the NTC. 

Primers:

1610H3.3_FWDCACGCTCTCCTCGAATCCTCJH5/21/20152055O.luridaHistone H3.3Q6P823
1609H3.3_REVAAGTTGCCTTTCCAGCGTCTJH5/21/20152055O.luridaHistone H3.3Q6P823


Reagent Table:
VolumeReactions X116
Ssofast Evagreen MM101160
FWD Primer0.558
REV Primer0.558
1:9 cDNA9
  1. Added reagents from greatest to least volume
  2. Vortexed
  3. Centrifuged briefly
  4. Pipetted 11 ul Master Mix to each tube
  5. Pipetted 9 ul of 1:9 cDNA each column using a channel pipetter
  6. Centrifuged plate at 2000 rpm for 1 minute
  7. Ran Program Below
Program:
StepTemperatureTime
Initiation95 C10 min
Elongation95 C30 sec
60 C1 min
Read
72 C30 sec
Read
Repeat Elongation 39 times
Termination95 C1 min
55 C1 sec
Melt Curve Manual ramp 0.2C per sec Read 0.5 C55 - 95 C30 sec
21 C10 min
End
Plate Layout:
1234567
DNased 42215 HC1DNased 42215 NC1DNased 42215 SC1DNased 42215 HT1 1DNased 42215 NT1 1DNased 42215 ST1 1NTC
DNased 42215 HC2DNased 42215 NC2DNased 42215 SC2DNased 42215 HT1 2DNased 42215 NT1 2DNased 42215 ST1 2NTC
DNased 42215 HC3DNased 42215 NC3DNased 42215 SC3DNased 42215 HT1 3DNased 42215 NT1 3DNased 42215 ST1 3NTC
DNased 42215 HC4DNased 42215 NC4DNased 42215 SC4DNased 42215 HT1 4DNased 42215 NT1 4DNased 42215 ST1 4NTC
DNased 42215 HC5DNased 42215 NC5DNased 42215 SC5DNased 42215 HT1 5DNased 42215 NT1 5DNased 42215 ST1 5
DNased 42215 HC6DNased 42215 NC6DNased 42215 SC6DNased 42215 HT1 6DNased 42215 NT1 6DNased 42215 ST1 6
DNased 42215 HC7DNased 42215 NC7DNased 42215 SC7DNased 42215 HT1 7DNased 42215 NT1 7DNased 42215 ST1 7
DNased 42215 HC8DNased 42215 NC8DNased 42215 SC8DNased 42215 HT1 8DNased 42215 NT1 8DNased 42215 ST1 8
Results:

All samples
NTCs

The amplification curves look great in this one. There is no amplification in the NTCs. Now I just need to compare the Ct values to confirm its good. 


The replicates look ok but not great. I generated a graph of the replicate difference. 


The difference between reps get above 3 Ct different. I will average these Ct's together to help alleviate these issues. 

You can see the raw data here.