Primers:
| 1640 | BMP-2_FWD | TGAAGGAACGACCAAAGCCA | JH | 5/21/2015 | 20 | 55 | O.lurida | Bone morphogenetic protein 2 (BMP-2) (Bone morphogenetic protein 2A) (BMP-2A) | P12643 | |
| 1639 | BMP-2_REV | TCCGGTTGAAGAACCTCGTG | JH | 5/21/2015 | 20 | 55 | O.lurida | Bone morphogenetic protein 2 (BMP-2) (Bone morphogenetic protein 2A) (BMP-2A) | P12643 |
Reagent Table:
| Volume | Reactions X116 | |
| Ssofast Evagreen MM | 10 | 1160 |
| FWD Primer | 0.5 | 58 |
| REV Primer | 0.5 | 58 |
| 1:9 cDNA | 9 |
- Added reagents from greatest to least volume
- Vortexed
- Centrifuged briefly
- Pipetted 11 ul Master Mix to each tube
- Pipetted 9 ul of 1:9 cDNA each column using a channel pipetter
- Centrifuged plate at 2000 rpm for 1 minute
- Ran Program Below
Program:
| Step | Temperature | Time |
| Initiation | 95 C | 10 min |
| Elongation | 95 C | 30 sec |
| 60 C | 1 min | |
| Read | ||
| 72 C | 30 sec | |
| Read | ||
| Repeat Elongation 39 times | ||
| Termination | 95 C | 1 min |
| 55 C | 1 sec | |
| Melt Curve Manual ramp 0.2C per sec Read 0.5 C | 55 - 95 C | 30 sec |
| 21 C | 10 min | |
| End |
Plate Layout:
| 1 | 2 | 3 | 4 | 5 | 6 | 7 |
| DNased 42215 HC1 | DNased 42215 NC1 | DNased 42215 SC1 | DNased 42215 HT1 1 | DNased 42215 NT1 1 | DNased 42215 ST1 1 | NTC |
| DNased 42215 HC2 | DNased 42215 NC2 | DNased 42215 SC2 | DNased 42215 HT1 2 | DNased 42215 NT1 2 | DNased 42215 ST1 2 | NTC |
| DNased 42215 HC3 | DNased 42215 NC3 | DNased 42215 SC3 | DNased 42215 HT1 3 | DNased 42215 NT1 3 | DNased 42215 ST1 3 | NTC |
| DNased 42215 HC4 | DNased 42215 NC4 | DNased 42215 SC4 | DNased 42215 HT1 4 | DNased 42215 NT1 4 | DNased 42215 ST1 4 | NTC |
| DNased 42215 HC5 | DNased 42215 NC5 | DNased 42215 SC5 | DNased 42215 HT1 5 | DNased 42215 NT1 5 | DNased 42215 ST1 5 | |
| DNased 42215 HC6 | DNased 42215 NC6 | DNased 42215 SC6 | DNased 42215 HT1 6 | DNased 42215 NT1 6 | DNased 42215 ST1 6 | |
| DNased 42215 HC7 | DNased 42215 NC7 | DNased 42215 SC7 | DNased 42215 HT1 7 | DNased 42215 NT1 7 | DNased 42215 ST1 7 | |
| DNased 42215 HC8 | DNased 42215 NC8 | DNased 42215 SC8 | DNased 42215 HT1 8 | DNased 42215 NT1 8 | DNased 42215 ST1 8 |
Results:
All samples

NTCs

These curves look okay but I'm not 100% okay with the bumpy melt curve. I ran an ANOVA and Tukey's HSD to produce significant differences for analysis. To improve the analysis and the boxplot/expression bar graph, I adjusted the data set by removing NA's from the data.
Adjusted Expression Graph
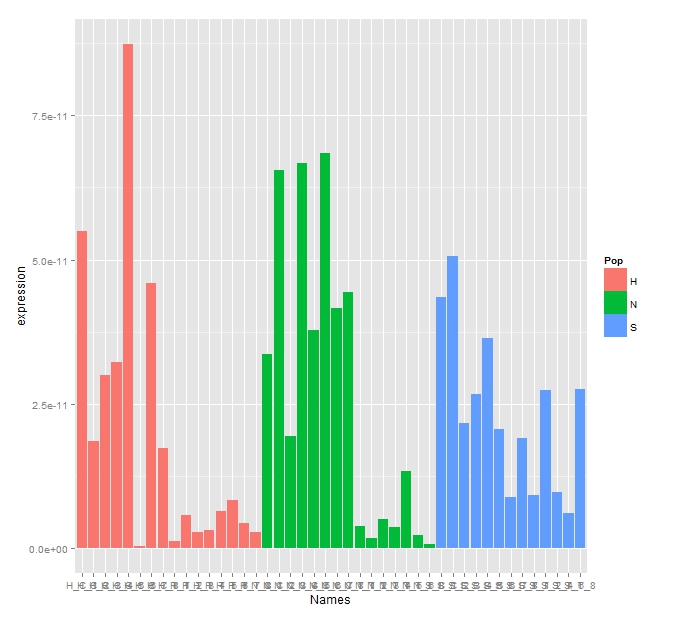
There's clearly some difference in expression as the appears to be chunks of the population that have much lowered expression.
Adjusted ANOVA/Tukey's HSD
Call:
aov(formula = expression ~ Pop + Treat + Pop:Treat, data = rep2res2)
Terms:
Pop Treat Pop:Treat Residuals
Sum of Squares 3.918260e-22 9.723005e-21 1.573763e-21 9.279358e-21
Deg. of Freedom 2 1 2 38
Residual standard error: 1.56267e-11
Estimated effects may be unbalanced
> TukeyHSD(fit)
Tukey multiple comparisons of means
95% family-wise confidence level
Fit: aov(formula = expression ~ Pop + Treat + Pop:Treat, data = rep2res2)
$Pop
diff lwr upr p adj
N-H 0.4224591
S-H 0.8174685
S-N 0.8189700
$Treat
diff lwr upr p adj
T-C 2e-07
$`Pop:Treat`
diff lwr upr p adj
N:C-H:C 0.6961640
S:C-H:C 0.9298189
H:T-H:C 0.0032438
N:T-H:C 0.0048368
S:T-H:C 0.2481527
S:C-N:C 0.1806352
H:T-N:C 0.0000405
N:T-N:C 0.0000732
S:T-N:C 0.0140727
H:T-S:C 0.0411016
N:T-S:C 0.0532668
S:T-S:C 0.7297433
N:T-H:T 1.0000000
S:T-H:T 0.7788719
S:T-N:T 0.7991437
There are significant differences between the Treatment and Control. There's also several significant differences between pop-treatment groups. Everything in bold is a significant difference. Clearly the Dabob treatment is different from the Dabob control, the Fidalgo treatment is different from Fidalgo control.
Adjusted Expression Boxplot

You can see the differences very well with the boxplot above.
You can see the raw data here.
No comments:
Post a Comment