Primers:
HSP70
FWD - TTGTCGCCATTTTCCTCGCT
REV - GTTCCGATTTGTTCCGTGCC
Reagent Table:
| Volume | Reactions X116 | |
| Ssofast Evagreen MM | 10 | 1160 |
| FWD Primer | 0.5 | 58 |
| REV Primer | 0.5 | 58 |
| 1:9 cDNA | 9 |
- Added reagents from greatest to least volume
- Vortexed
- Centrifuged briefly
- Pipetted 11 ul Master Mix to each tube
- Pipetted 9 ul of 1:9 cDNA each column using a channel pipetter
- Centrifuged plate at 2000 rpm for 1 minute
- Ran Program Below
Program:
| Step | Temperature | Time |
| Initiation | 95 C | 10 min |
| Elongation | 95 C | 30 sec |
| 60 C | 1 min | |
| Read | ||
| 72 C | 30 sec | |
| Read | ||
| Repeat Elongation 39 times | ||
| Termination | 95 C | 1 min |
| 55 C | 1 sec | |
| Melt Curve Manual ramp 0.2C per sec Read 0.5 C | 55 - 95 C | 30 sec |
| 21 C | 10 min | |
| End |
Plate Layout:
| 1 | 2 | 3 | 4 | 5 | 6 | 7 |
| DNased 42215 HC1 | DNased 42215 NC1 | DNased 42215 SC1 | DNased 42215 HT1 1 | DNased 42215 NT1 1 | DNased 42215 ST1 1 | NTC |
| DNased 42215 HC2 | DNased 42215 NC2 | DNased 42215 SC2 | DNased 42215 HT1 2 | DNased 42215 NT1 2 | DNased 42215 ST1 2 | NTC |
| DNased 42215 HC3 | DNased 42215 NC3 | DNased 42215 SC3 | DNased 42215 HT1 3 | DNased 42215 NT1 3 | DNased 42215 ST1 3 | NTC |
| DNased 42215 HC4 | DNased 42215 NC4 | DNased 42215 SC4 | DNased 42215 HT1 4 | DNased 42215 NT1 4 | DNased 42215 ST1 4 | NTC |
| DNased 42215 HC5 | DNased 42215 NC5 | DNased 42215 SC5 | DNased 42215 HT1 5 | DNased 42215 NT1 5 | DNased 42215 ST1 5 | |
| DNased 42215 HC6 | DNased 42215 NC6 | DNased 42215 SC6 | DNased 42215 HT1 6 | DNased 42215 NT1 6 | DNased 42215 ST1 6 | |
| DNased 42215 HC7 | DNased 42215 NC7 | DNased 42215 SC7 | DNased 42215 HT1 7 | DNased 42215 NT1 7 | DNased 42215 ST1 7 | |
| DNased 42215 HC8 | DNased 42215 NC8 | DNased 42215 SC8 | DNased 42215 HT1 8 | DNased 42215 NT1 8 | DNased 42215 ST1 8 |
Results:
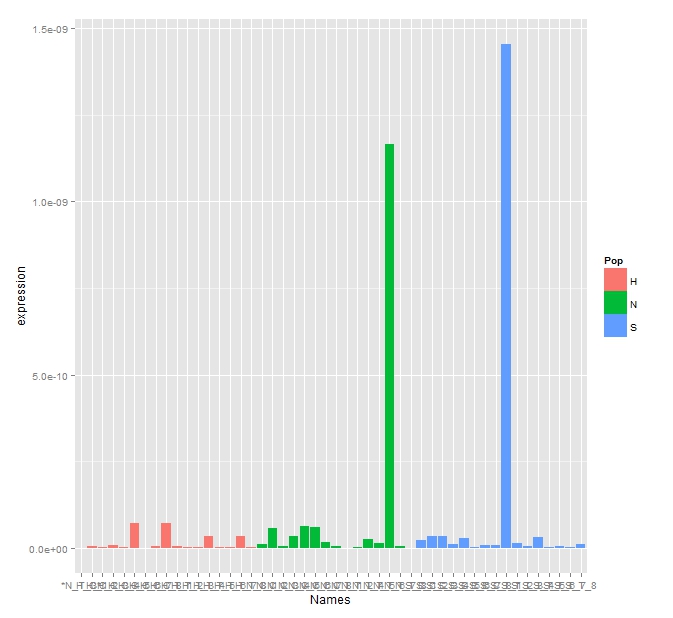
All samples

NTCs

This looks interesting in terms of expression, there is some amplification in the NTCs but it was a product much larger than the target. To see if there are any interesting expression levels I ran this through an ANOVA and Tukey's HSD to produce any significant differences between the treatment, control, and populations.
Call:
aov(formula = expression ~ Pop + Treat + Pop:Treat, data = rep2res2)
Terms:
Pop Treat Pop:Treat Residuals
Sum of Squares 7.777300e-20 1.174464e-19 7.510100e-20 2.988660e-18
Deg. of Freedom 2 1 2 41
Residual standard error: 2.699892e-10
Estimated effects may be unbalanced
1 observation deleted due to missingness
> TukeyHSD(fit)
Tukey multiple comparisons of means
95% family-wise confidence level
Fit: aov(formula = expression ~ Pop + Treat + Pop:Treat, data = rep2res2)
$Pop
p adj
N-H 0.6768333
S-H 0.6234033
S-N 0.9972407
$Treat
p adj
T-C 0.2116992
$`Pop:Treat`
p adj
N:C-H:C 0.9999993
S:C-H:C 1.0000000
H:T-H:C 0.9999997
N:T-H:C 0.8823690
S:T-H:C 0.8051192
S:C-N:C 0.9999986
H:T-N:C 0.9999855
N:T-N:C 0.9123072
S:T-N:C 0.8463452
H:T-S:C 0.9999999
N:T-S:C 0.8771414
S:T-S:C 0.7981469
N:T-H:T 0.8524787
S:T-H:T 0.7660122
S:T-N:T 0.9999953
There's no significant differences between anything which is very surprising as I would expect at least a strong difference between treatment and control. Steven has suggested that this primer may not actually be for HSP70 since we did not develop it. These results seem to confirm it though. The expression graph produced from the expression data doesn't seem to be of any help either. I think I may need to go redevelop some primers for HSP70 to hopefully get one that works.
You can see the raw data here.
No comments:
Post a Comment